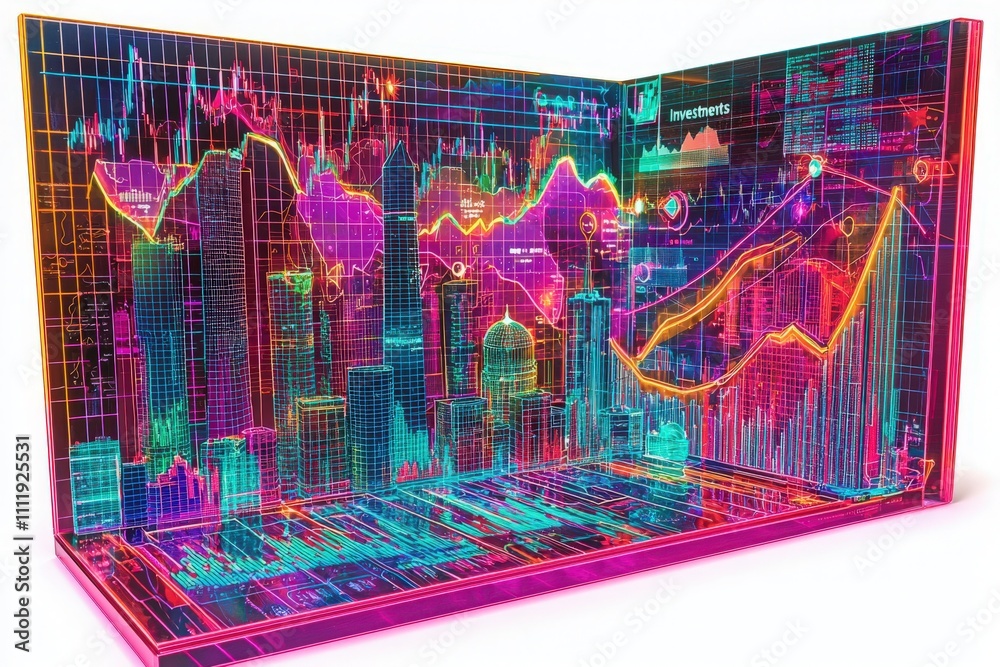
Bright neon graphics illustrate complex investment data, showcasing trends and analytics. The visualization captures market fluctuations in a vibrant urban setting, emphasizing financial growth.

Bright neon graphics illustrate complex investment data, showcasing trends and analytics. The visualization captures market fluctuations in a vibrant urban setting, emphasizing financial growth.