AIHRG Design
About Us
Privacy Policy
Tag Cloud
Terms of Use
Tag:
analysis
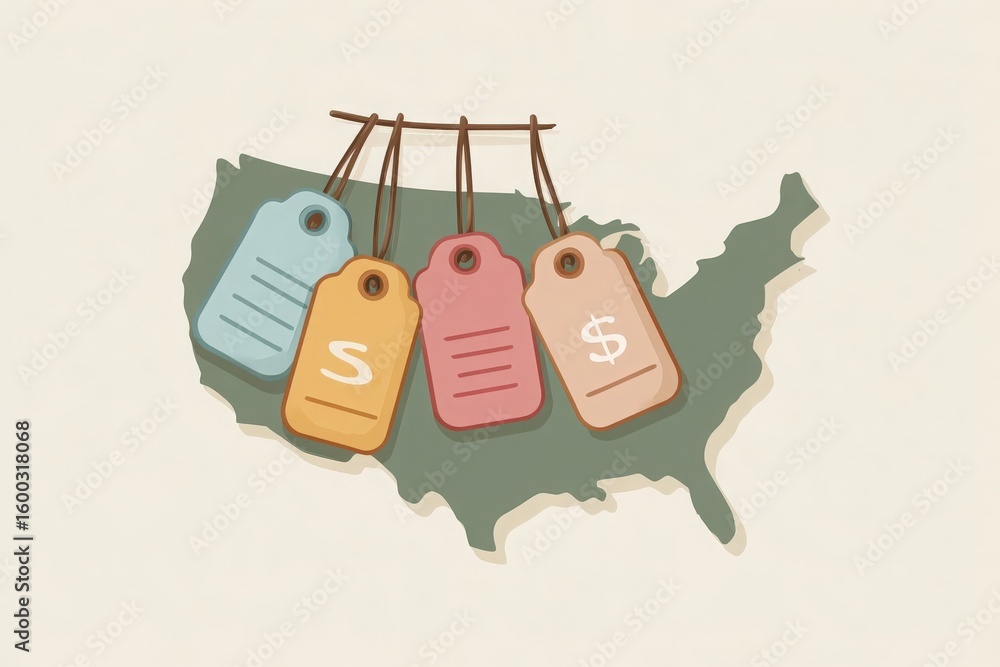
A detailed illustration shows a map of the United States with colorful price tags hanging from the outline.
Two human figures stand beside a large chart showcasing business growth and analytics, surrounded by vibrant pink foliage and gift boxes, illustrating a modern, creative workspace.
Two professionals stand beside large dollar and upward trend indicators. Surrounding them are stacks of coins and growth charts, illustrating financial analysis and business success themes.
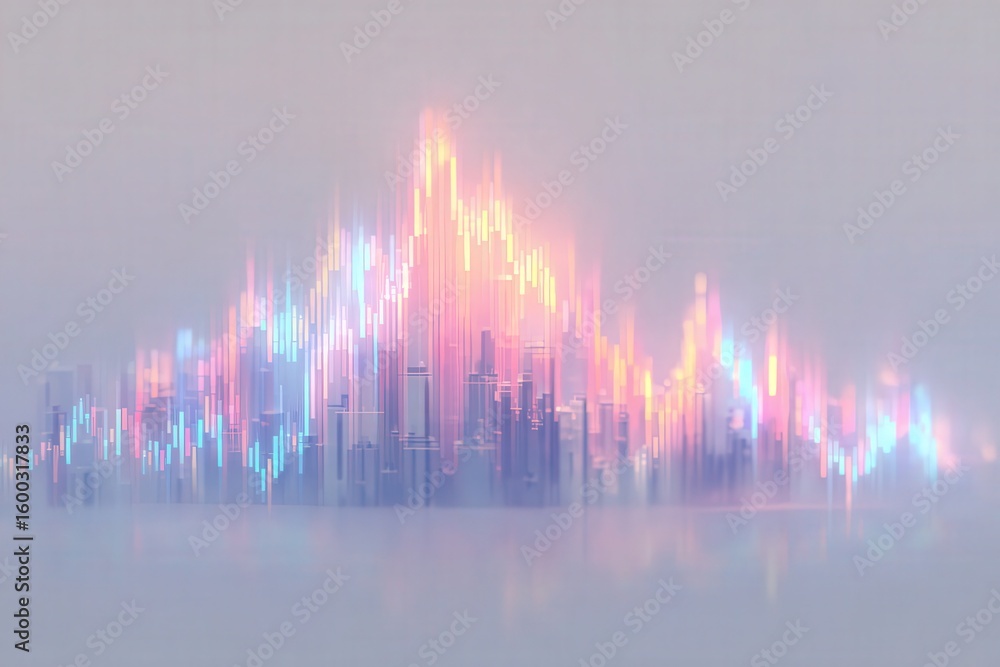
Bright waves of color rise and fall, resembling a city skyline shrouded in mist. The vibrant hues blend together, creating a dynamic visualization of urban life and activity.
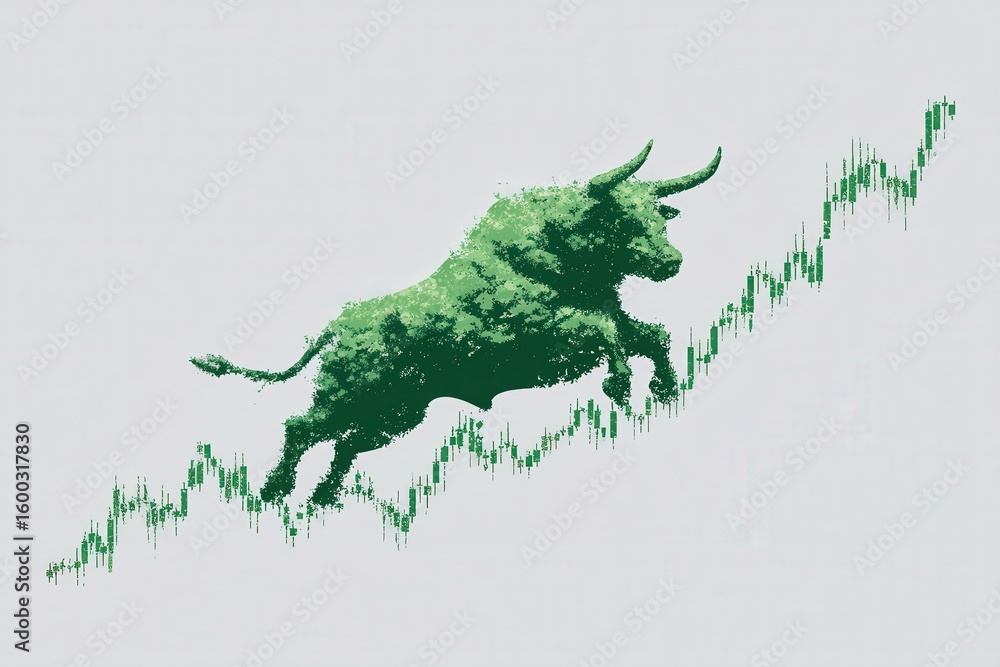
A vibrant green bull leaps energetically along a rising graph, representing growth and confidence in the stock market. The image conveys financial momentum and a positive outlook for investors.
A powerful red bull stands triumphantly, embodying the bullish sentiment of the financial market. Behind it, a rising graph illustrates upward trends in stock prices, highlighting optimism.
A graphic displays a stock market line chart illustrating a consistent upward trend. Fluctuations indicate growth alongside periodic corrections. Data suggests a positive market sentiment.
An abstract graph displays a vibrant upward trend marked by hues of purple, pink, and orange. The fluctuating peaks and valleys represent dynamic data patterns and analysis.
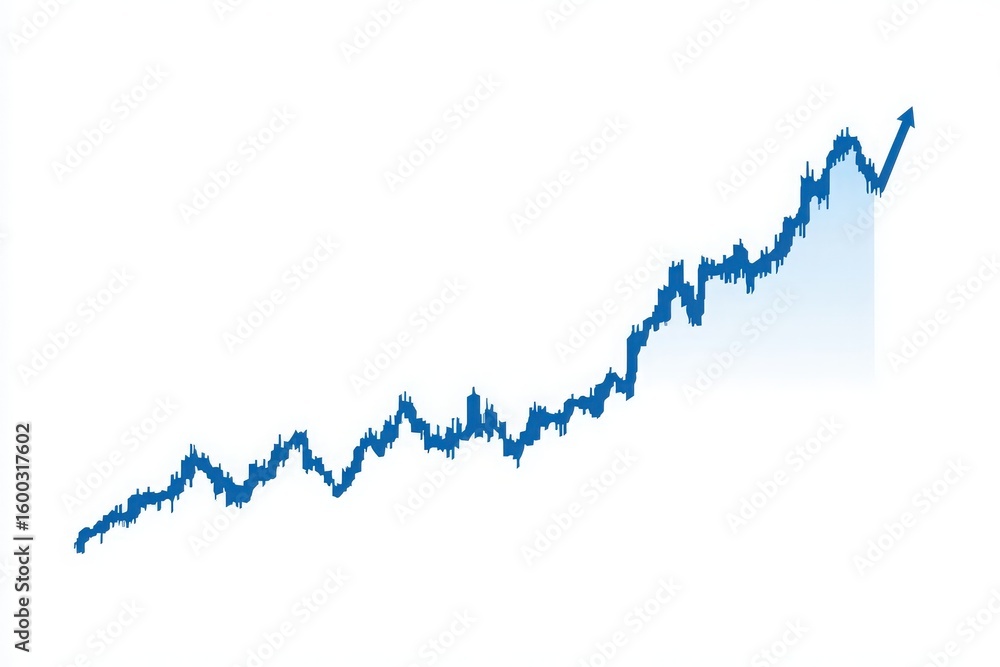
The diagram illustrates a strong upward trend in stock prices with varying shades of blue. The chart highlights significant increases over a period, representing market growth and investor confidence.
A business analyst sits at a desk, silhouetted against a large screen displaying vibrant financial graphs. The scene captures the essence of market evaluation during late hours.
Previous Page
1
…
5
6
7
8
Next Page
We use cookies to ensure that we give you the best experience on our website. If you continue to use this site we will assume that you are happy with it.
Ok