AIHRG Design
About Us
Privacy Policy
Tag Cloud
Terms of Use
Tag:
bar diagram
A bar graph displays data progression with bars in blue, red, yellow, and orange on a dark backdrop. Bokeh lights create a lively atmosphere, enhancing the visual impact of the growth representation.
A blue upward arrow and bar graph represent growth and improvement. This visual conveys a strong message about increasing trends in business metrics and financial performance.
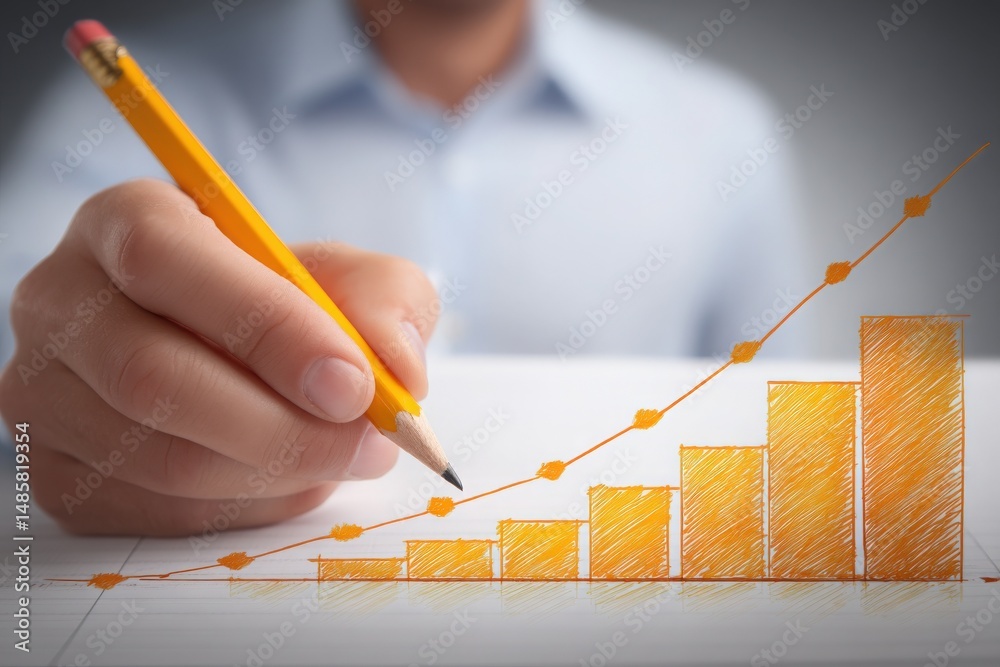
A person is holding a yellow pencil and creating a simple bar graph on a sheet of paper. The graph displays ascending bars symbolizing growth, showcasing a professional environment.
Colorful charts and graphs are displayed alongside colorful bars and pie charts, illustrating various aspects of financial planning. Data visualizations and reports are arranged for analysis.
We use cookies to ensure that we give you the best experience on our website. If you continue to use this site we will assume that you are happy with it.
Ok