AIHRG Design
About Us
Privacy Policy
Tag Cloud
Terms of Use
Tag:
fluctuation
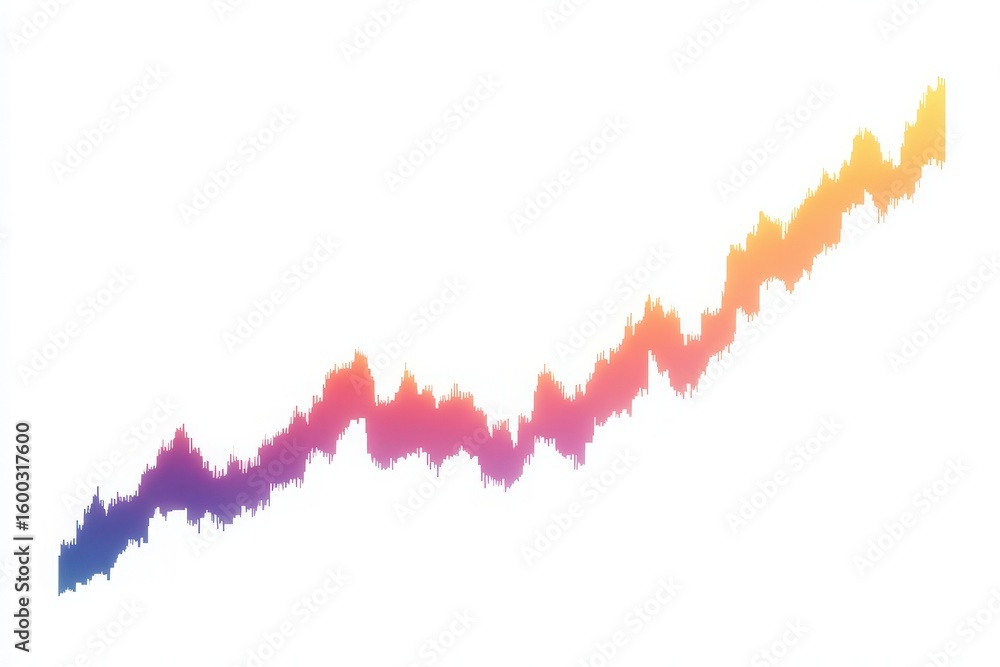
An abstract graph displays a vibrant upward trend marked by hues of purple, pink, and orange. The fluctuating peaks and valleys represent dynamic data patterns and analysis.
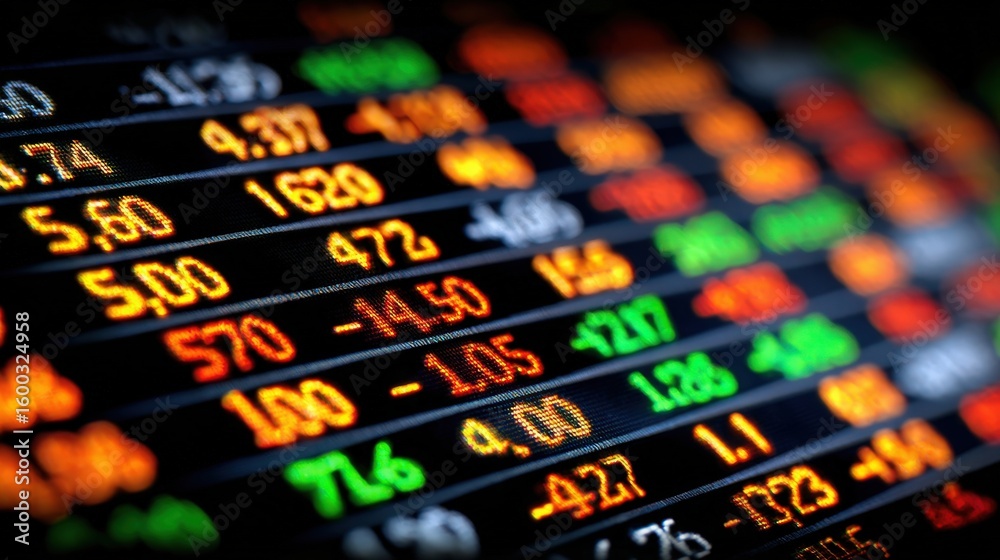
A close-up view of a stock market display featuring various colored numbers indicating price changes.
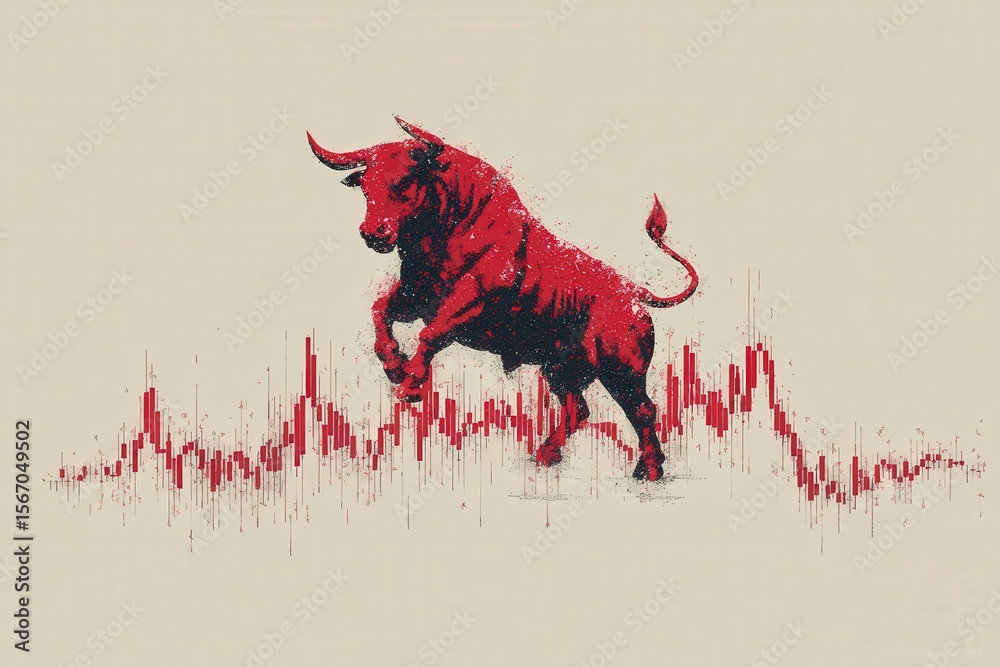
A powerful red bull leaps in front of a rising stock market graph. This visual represents optimism and growth in financial markets, highlighting trading dynamics in a vibrant manner.
A vibrant illustration showcases a heart rate monitor displaying fluctuating waves of red and blue light. The background features a blurred cityscape, enhancing the tech-inspired ambiance.
We use cookies to ensure that we give you the best experience on our website. If you continue to use this site we will assume that you are happy with it.
Ok