AIHRG Design
About Us
Privacy Policy
Tag Cloud
Terms of Use
Tag:
infographic
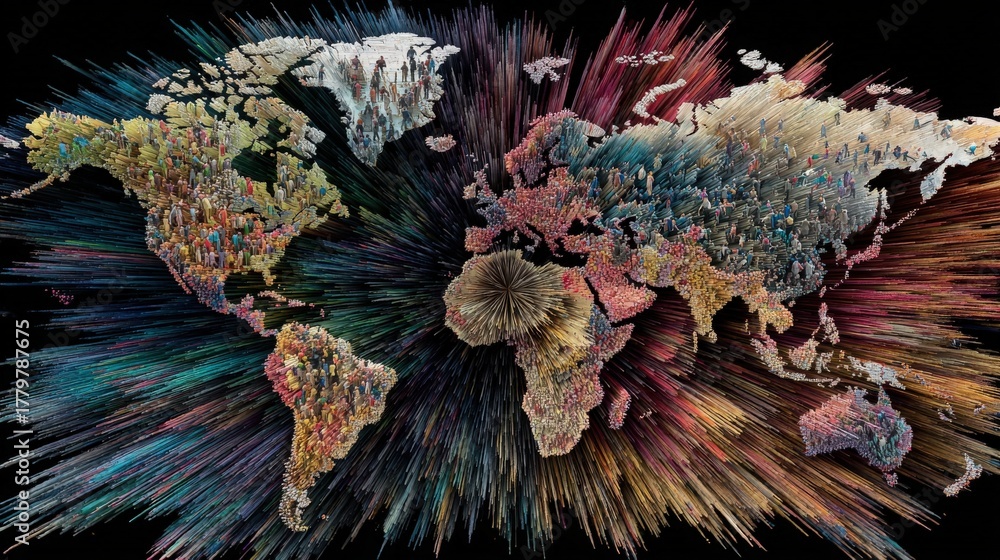
This unique world map displays a 3D representation of global population data, featuring colorful spikes and textures that highlight different regions. The design is both artistic and informative.
A mix of blue and white triangles forms an abstract design, creating a striking visual effect. The dark background enhances the colorful triangles, adding depth and contrast to the artwork.
An airplane accelerates down the runway, lifting off into the clear blue sky. The scene captures the excitement of travel, with the airport bustling below during daylight.
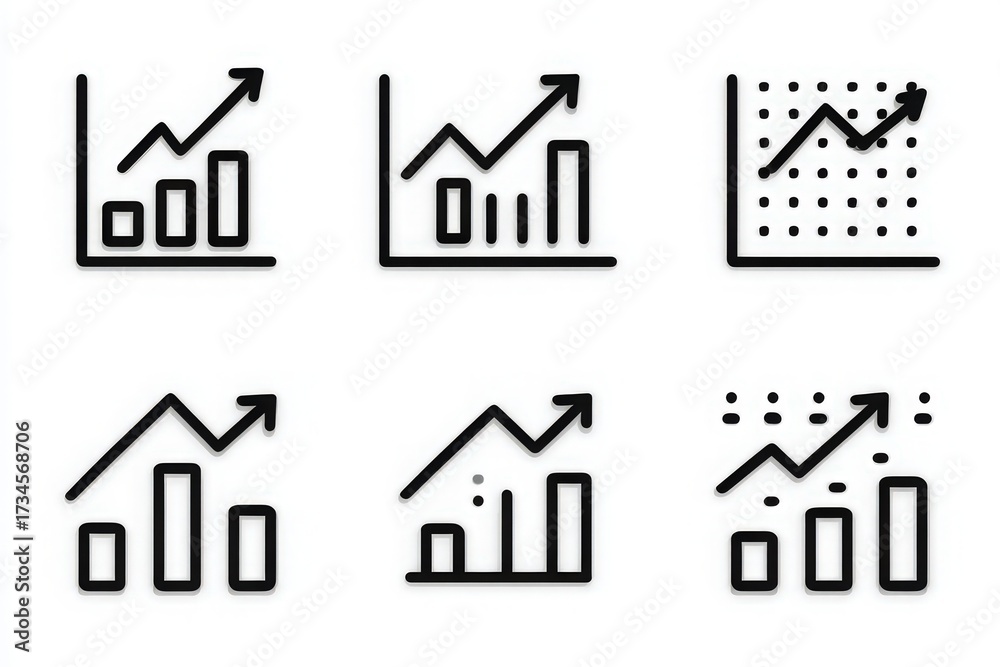
This visual showcases six different styles of graphs, all depicting an upward trend. These representations are commonly used for data analysis, illustrating growth and progress in various fields.
Vibrant arrows in blue, orange, purple, and green create a dynamic visual of growth and progress against a dark background, showcasing a playful blend of shapes and colors.
An oil pump jack is actively extracting crude oil in a digital landscape filled with scientific diagrams and data points.
A colorful graphic showing a cloud with cogs and a rising line graph. The design illustrates concepts of technology and data growth, emphasizing progress in digital analytics and cloud solutions.
This artistic depiction showcases the map of the United States filled with colorful icons and symbols representing diverse activities and themes related to each state.
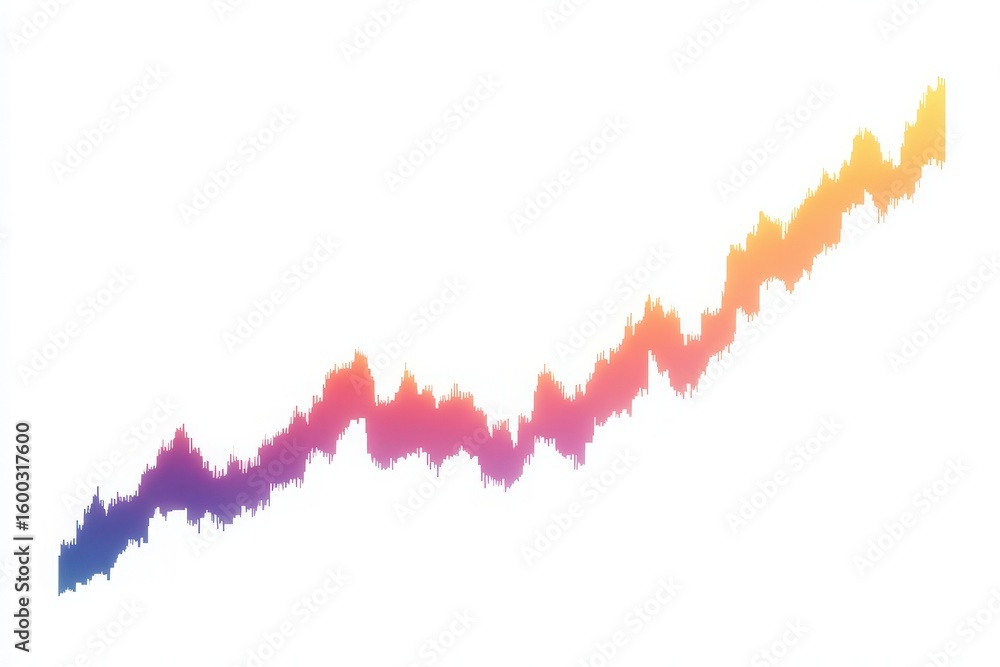
An abstract graph displays a vibrant upward trend marked by hues of purple, pink, and orange. The fluctuating peaks and valleys represent dynamic data patterns and analysis.
This visual depicts a three-dimensional data analytics concept featuring various blue charts and colorful location pins. The design highlights the importance of location in data presentation.
1
2
3
4
Next Page
We use cookies to ensure that we give you the best experience on our website. If you continue to use this site we will assume that you are happy with it.
Ok