AIHRG Design
About Us
Privacy Policy
Tag Cloud
Terms of Use
Tag:
infographics
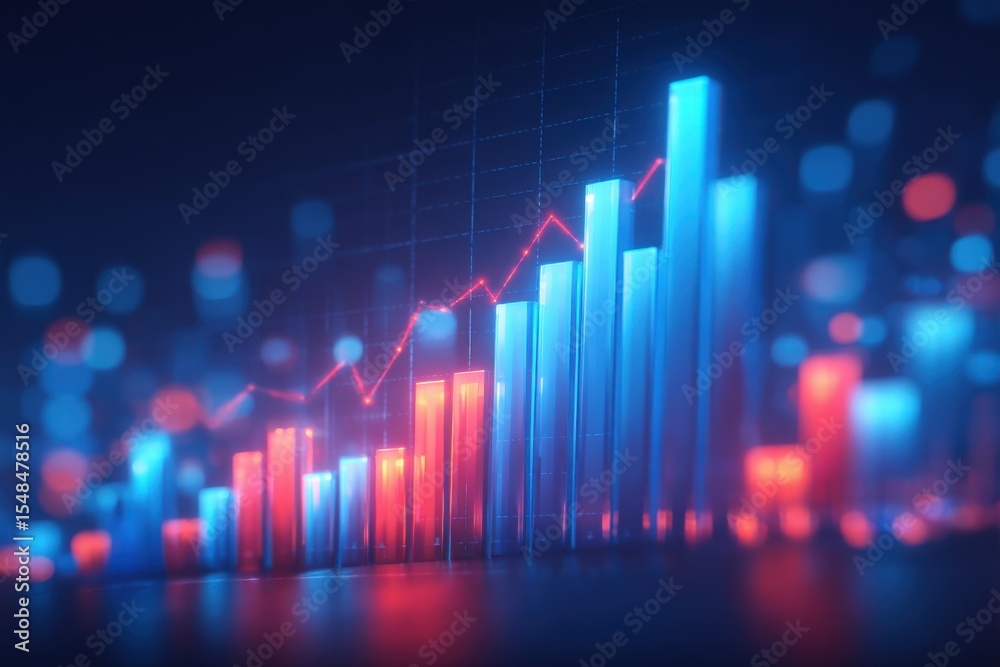
Vibrant bars represent various data points in red and blue, illustrating a rise in metrics.
We use cookies to ensure that we give you the best experience on our website. If you continue to use this site we will assume that you are happy with it.
Ok