AIHRG Design
About Us
Privacy Policy
Tag Cloud
Terms of Use
Tag:
monitoring
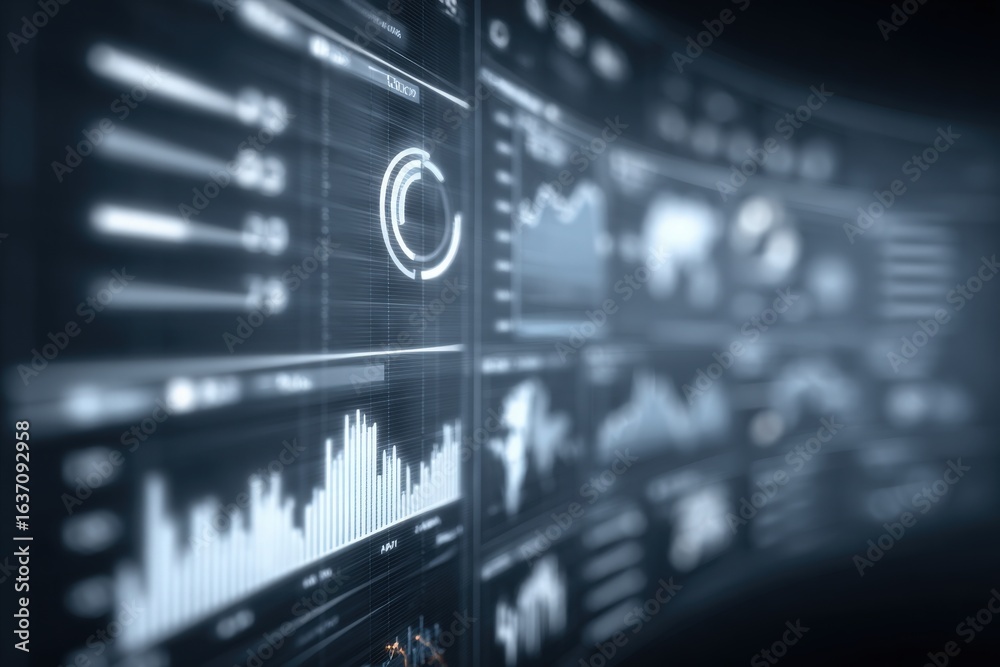
The dashboard displays multiple charts and graphs, illustrating performance metrics and trends. The visuals are designed for data analysis and interpretation in a modern technological environment.
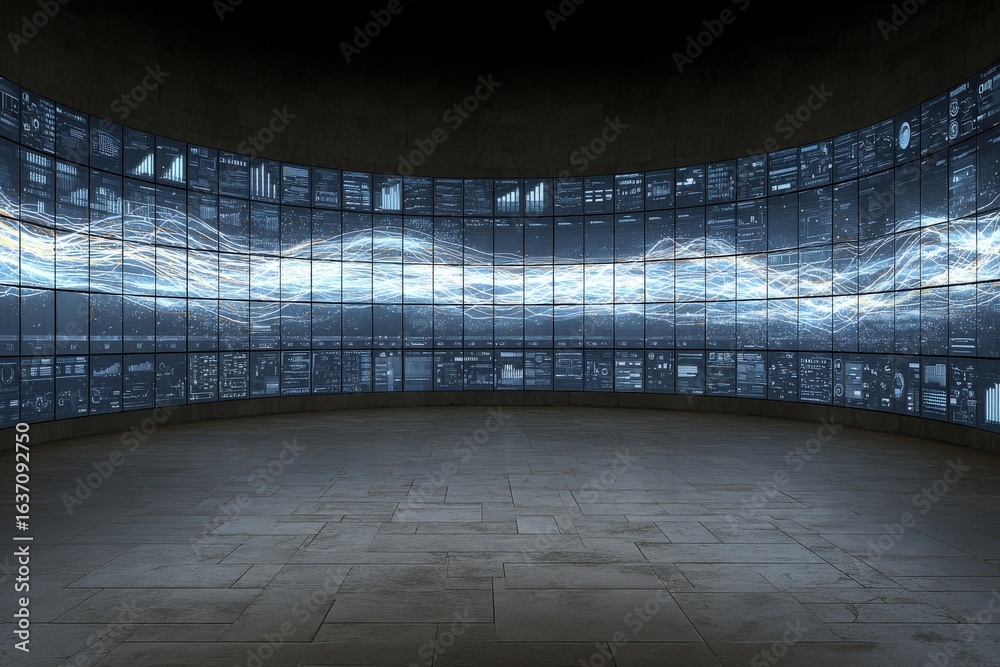
A circular room filled with multiple high-definition screens displays various graphs, charts, and dynamic data streams. The environment appears futuristic and is well-lit, emphasizing the technology.
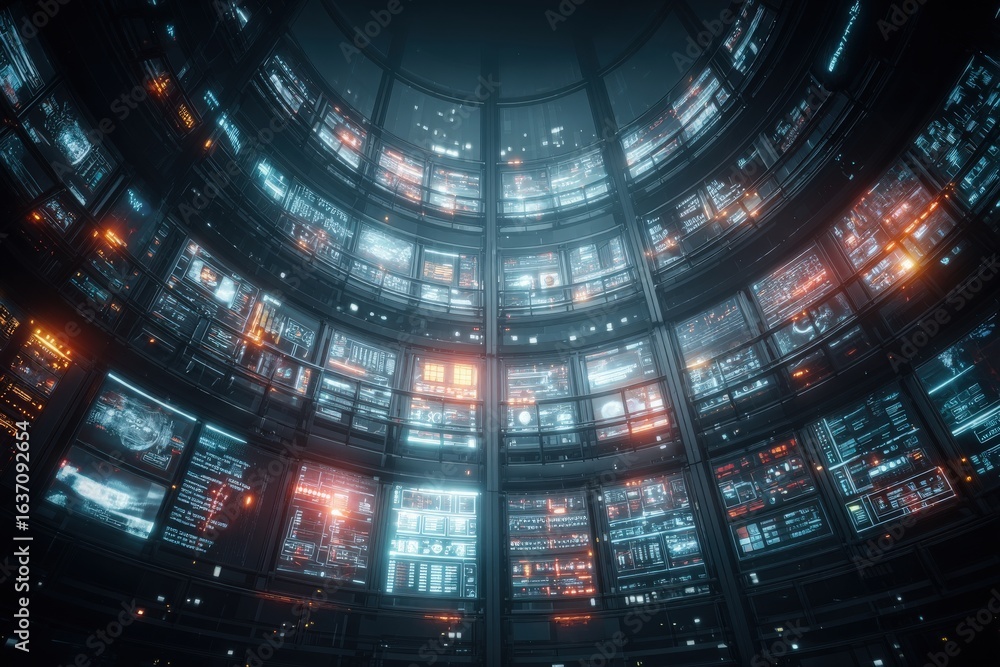
A high-tech control room features an array of screens illuminated with vibrant blue and orange lights. The complex visual displays show various data and analytics, creating an immersive atmosphere.
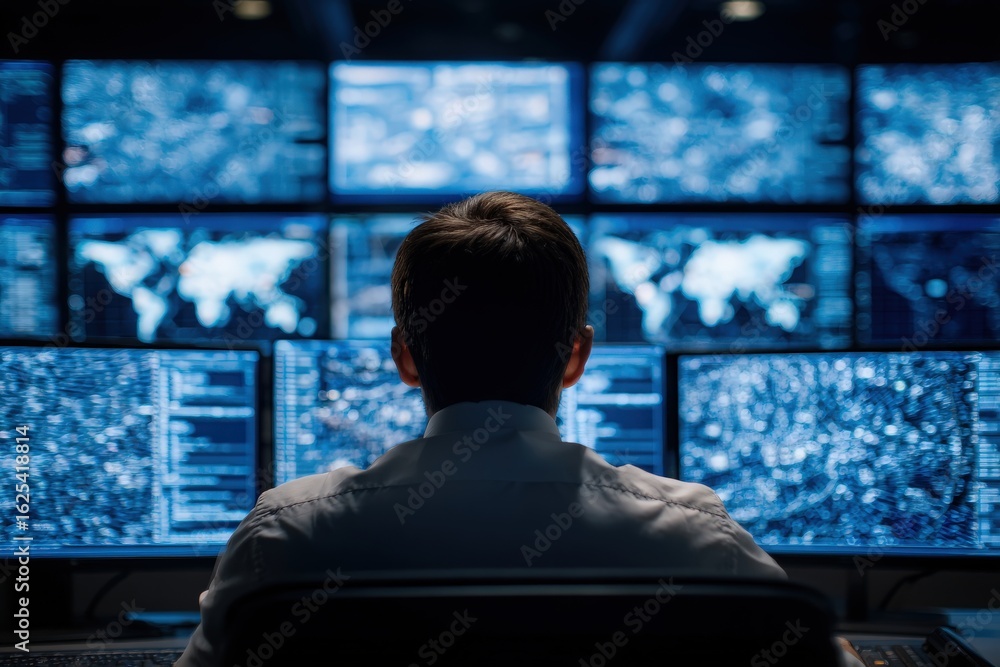
An individual observes numerous screens displaying complex data visualizations in a control room.
A digital thermometer shows a temperature reading of 45 degrees Celsius. The sleek white design contrasts with the neutral wall behind it, emphasizing the high temperature reading.
Previous Page
1
2
We use cookies to ensure that we give you the best experience on our website. If you continue to use this site we will assume that you are happy with it.
Ok