AIHRG Design
About Us
Privacy Policy
Tag Cloud
Terms of Use
Tag:
planning
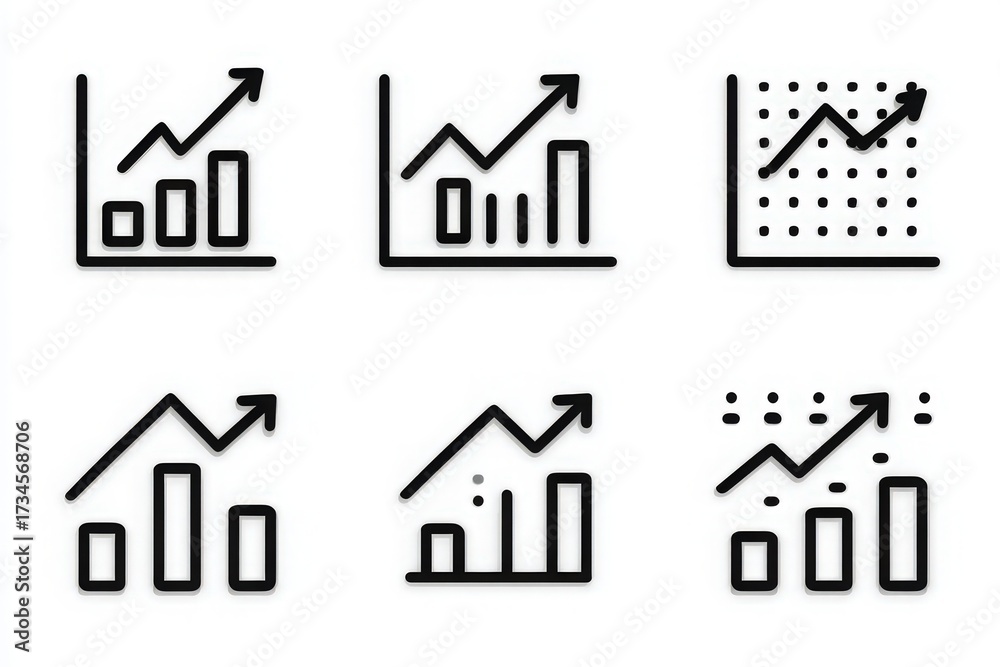
This visual showcases six different styles of graphs, all depicting an upward trend. These representations are commonly used for data analysis, illustrating growth and progress in various fields.
A simple growth chart illustrates an upward trend in data. The bars represent different values, and an arrow indicates positive movement, highlighting progress over a period.
A simple yet effective design illustrates a growth chart with a line and bar graph. The upward trend emphasizes positive growth, ideal for presentations and reports.
This visual represents a growth chart with upward trends, indicating progress in data or performance metrics. The lines and bars illustrate rising values, symbolizing improvement.
A man in a suit and glasses stands smiling while holding a clipboard. He appears friendly and professional, ready to offer assistance or check off tasks. The background is simple and minimalistic.
Two professionals are looking at products in a contemporary retail environment.
A group of individuals listens attentively to a speaker presenting in a high-tech conference room. Multiple screens display various data and visuals related to the topic.
A group of engineers in safety helmets stands in a high-tech control room. One leader gestures while explaining a project. The team listens attentively to his guidance and insights.
Two business professionals discuss a project in a low-lit environment with city lights shining in the background, reflecting a focused work atmosphere during evening hours.
Two men in formal attire stand together, analyzing a laptop while wind turbines spin in the background. The scene captures a moment of teamwork and technology in a sustainable environment.
Previous Page
1
2
3
4
5
…
50
Next Page
We use cookies to ensure that we give you the best experience on our website. If you continue to use this site we will assume that you are happy with it.
Ok