AIHRG Design
About Us
Privacy Policy
Tag Cloud
Terms of Use
Tag:
statistic
An individual observes numerous screens displaying complex data visualizations in a control room.
A detailed map of Europe is displayed, featuring a prominent flame icon at its center. This visual symbolizes current energy challenges, particularly in gas supply.
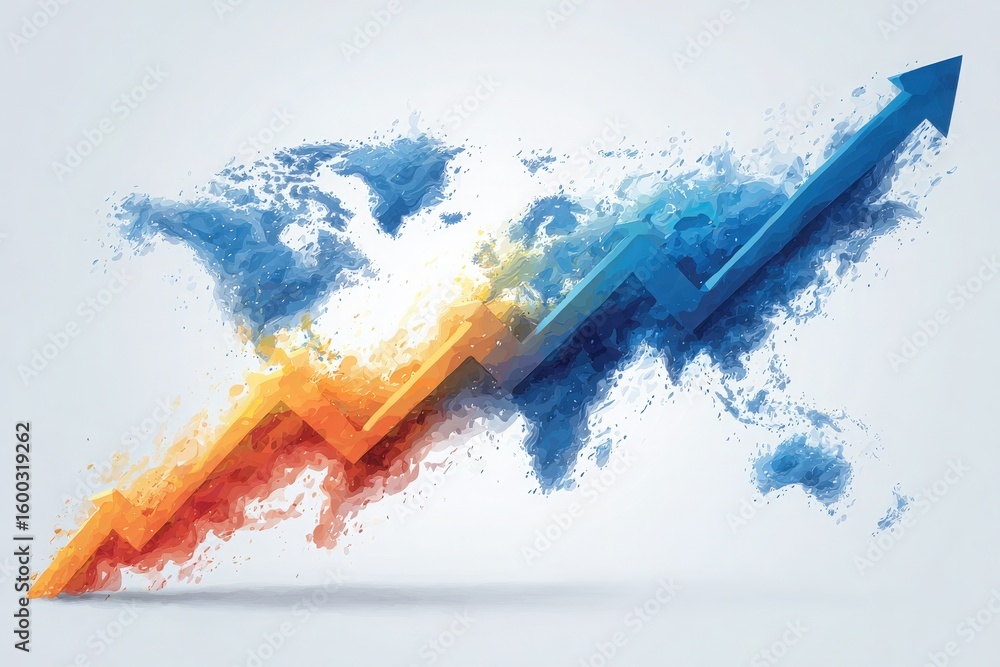
Vivid colors illustrate a rising trend over an artistic world map, highlighting global economic growth. The design features orange and blue arrows symbolizing progress and increase in data.
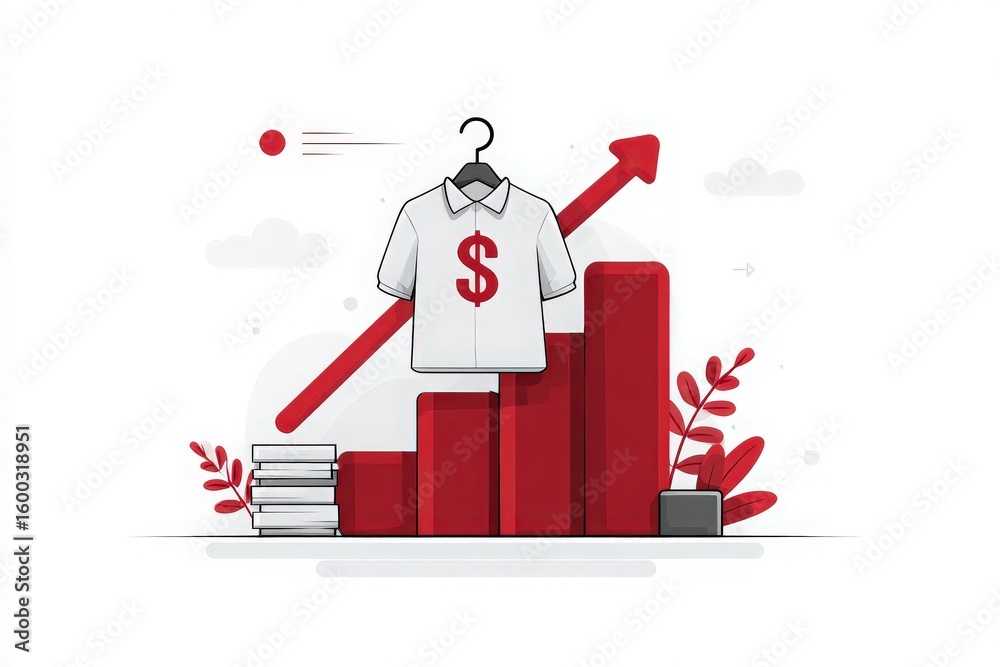
A creative illustration showcases a shirt featuring a dollar sign on a hanger above rising bar graphs. Surrounding elements include stacks of books and decorative plants, representing business growth.
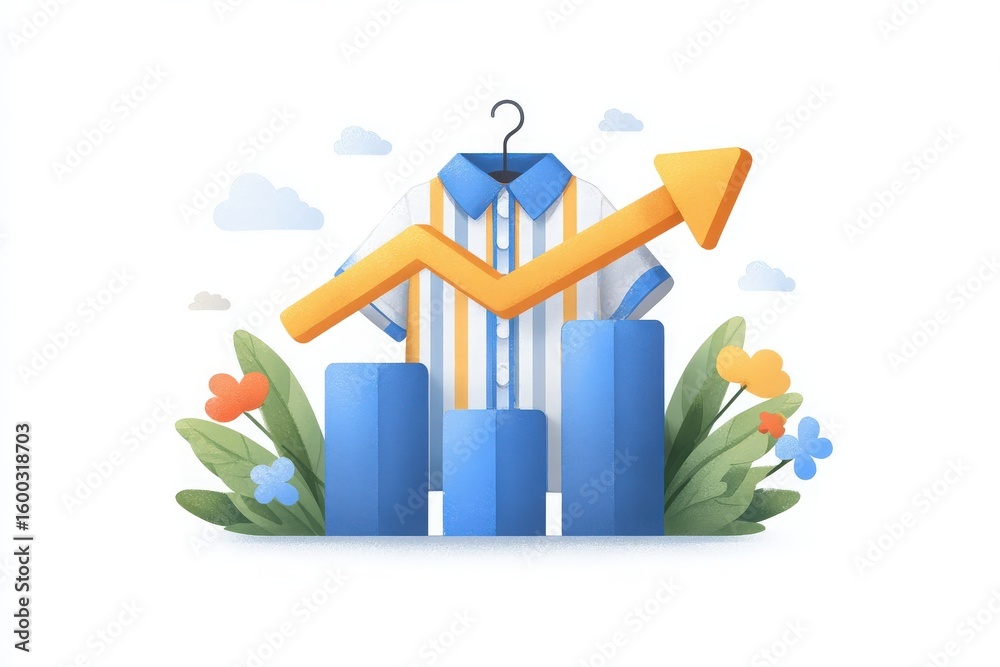
A vibrant display of a shirt hanging on a hanger alongside a rising graph, illustrating growth. Bright greenery and flowers enhance the appealing visual, symbolizing success in the fashion market.
A colorful shirt hangs on a hanger with a growth chart rising alongside. The scene shows stylized blue bars representing sales figures, surrounded by vibrant foliage and flowers.
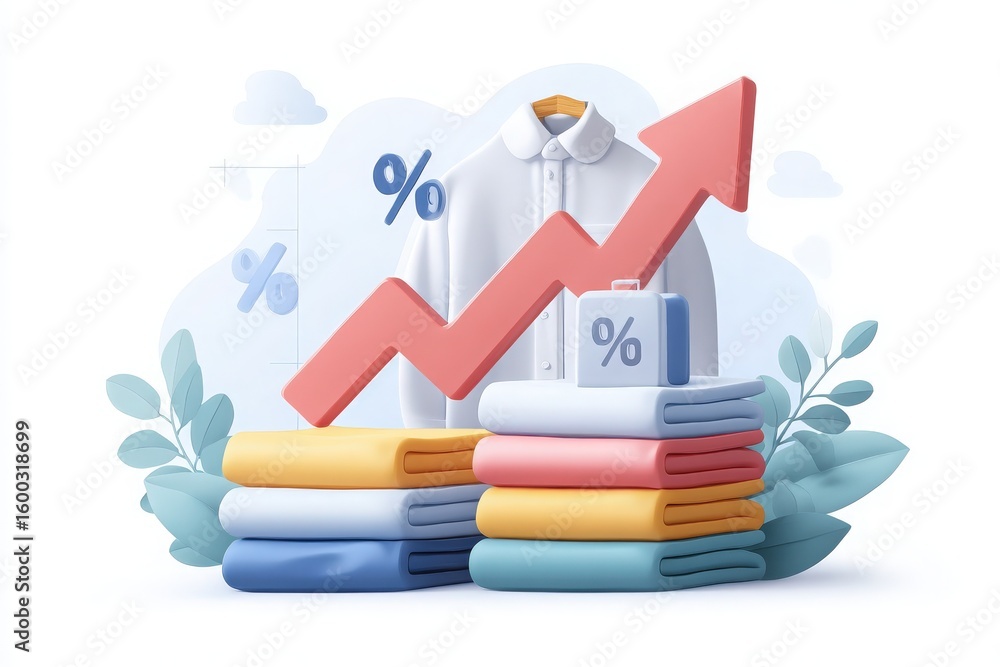
A visual representation of clothing sales growth featuring several neatly stacked garments in various colors, a bold upward trend line with percentages, and a briefcase for business context.
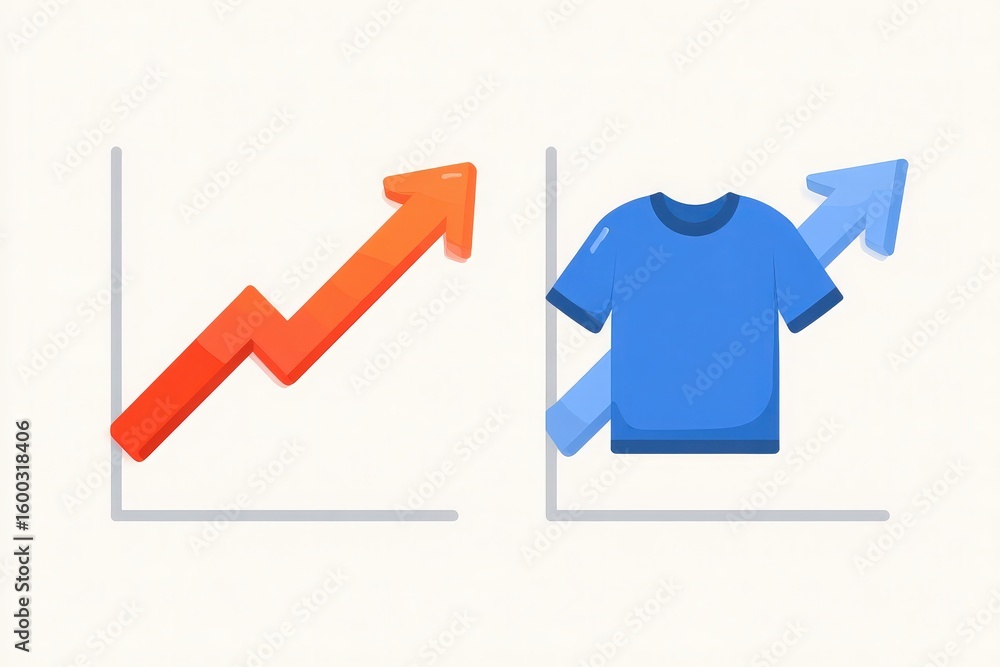
Illustrations depict two upward-trending graphs, one showing a rising line indicating general trends, while the other represents an increase in clothing sales.
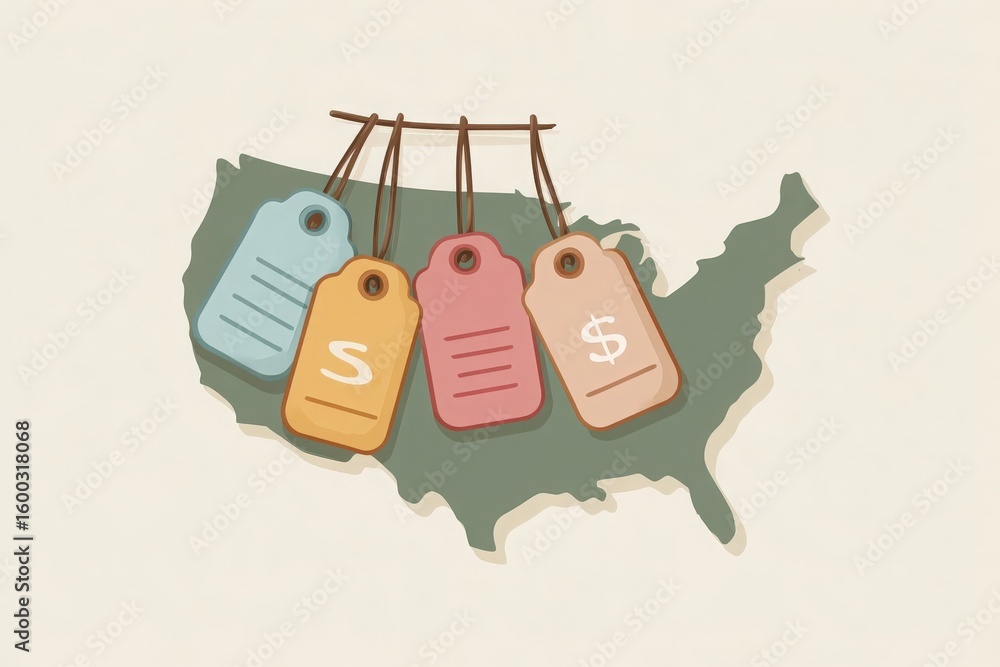
A detailed illustration shows a map of the United States with colorful price tags hanging from the outline.
Two human figures stand beside a large chart showcasing business growth and analytics, surrounded by vibrant pink foliage and gift boxes, illustrating a modern, creative workspace.
Previous Page
1
2
3
4
5
6
Next Page
We use cookies to ensure that we give you the best experience on our website. If you continue to use this site we will assume that you are happy with it.
Ok