AIHRG Design
About Us
Privacy Policy
Tag Cloud
Terms of Use
Tag:
statistics
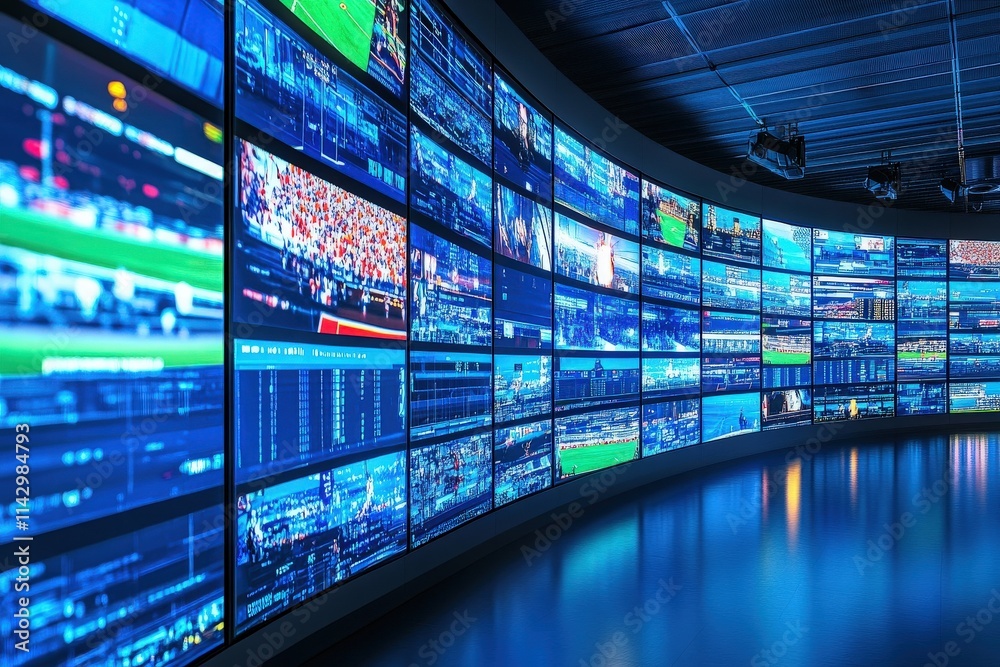
In a high-tech room, numerous screens display real-time sports statistics, games, and analytics. The setup supports advanced analysis and enhances viewer engagement during live events.
Three business professionals collaborate at a table covered with financial charts, reports, and gold bitcoins while discussing cryptocurrency market trends during a meeting.
Bright colors and abstract shapes fill the background as a scale symbolizes the balance between work and life.
A digital marketing expert focuses on various data visualizations and graphs. The workspace features vibrant colors, highlighting technologys role in social media analysis and strategy development.
A vibrant graphic design featuring a vintage microphone surrounded by various icons symbolizing podcasting, audio production, and data analytics.
A futuristic piggy bank design appears surrounded by holographic financial charts and data. It symbolizes saving money and investment strategies in a high-tech environment.
Colorful elements illustrate various aspects of planning, including charts, graphs, and icons representing data analysis, project management, and strategic thinking.
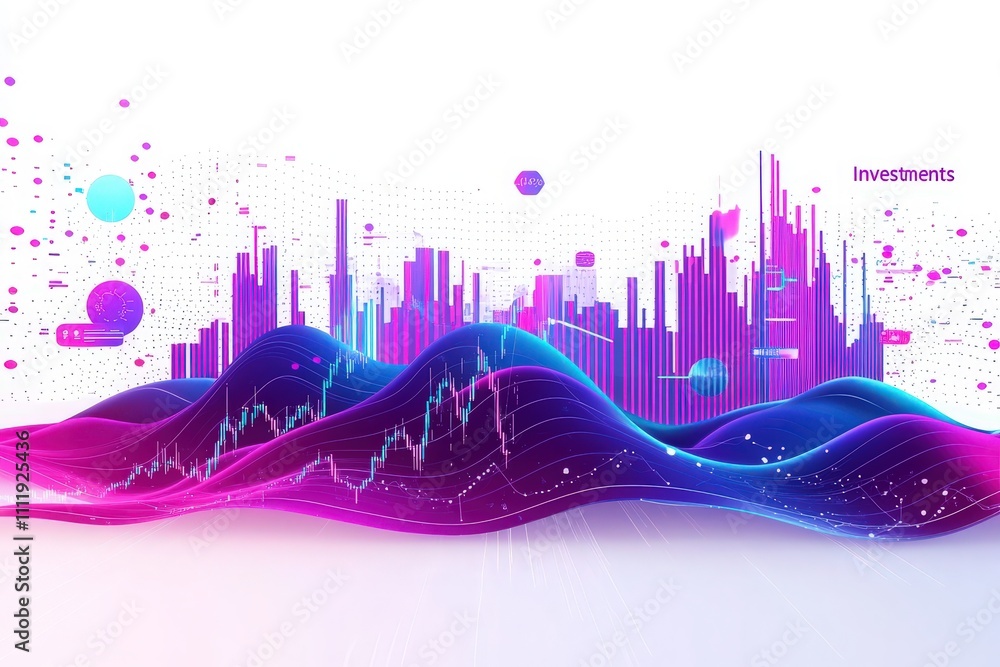
Bright neon graphics illustrate complex investment data, showcasing trends and analytics. The visualization captures market fluctuations in a vibrant urban setting, emphasizing financial growth.
This artwork illustrates investment trends through colorful waves and dynamic data points, symbolizing financial growth. The background features abstract graphs and data analysis elements.
A vibrant digital visualization of the globe emphasizes investment opportunities across different regions.
Previous Page
1
…
5
6
7
8
9
Next Page
We use cookies to ensure that we give you the best experience on our website. If you continue to use this site we will assume that you are happy with it.
Ok