AIHRG Design
About Us
Privacy Policy
Tag Cloud
Terms of Use
Tag:
visualisation
A simple yet effective design illustrates a growth chart with a line and bar graph. The upward trend emphasizes positive growth, ideal for presentations and reports.
Nine unique black and white laboratory flask icons are arranged in a neat grid. Each flask varies in shape and design, showcasing different icons inside.
This visual represents a growth chart with upward trends, indicating progress in data or performance metrics. The lines and bars illustrate rising values, symbolizing improvement.
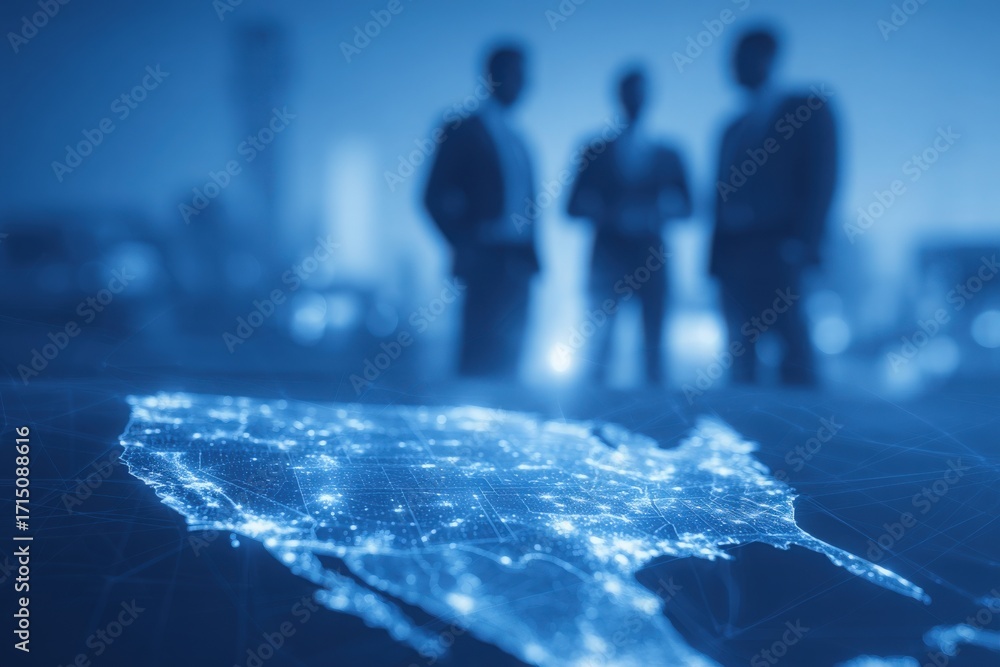
Three business professionals stand in silhouette against a city backdrop. In the foreground, a glowing digital map illustrates connectivity across a region, emphasizing data-driven discussions.
A business professional presents important data insights in a modern office. He gestures towards large digital screens displaying graphs and charts, emphasizing key points.
Neon gears and a brain design represent concepts related to artificial intelligence and technology. This modern arrangement highlights the interplay between machinery and cognitive processes.
This visual displays a brightly lit neon brain surrounded by colorful gears on a black background. It emphasizes the relationship between creativity, technology, and innovation.
Several colorful gears are arranged in a stacked formation against a soft gray background, showcasing vibrant hues of orange, green, blue, yellow, and white. The design is modern and engaging.
Bright orange and blue dots intertwine in a flowing pattern against a dark background, symbolizing data transfer and digital connectivity, creating a dynamic and energetic visual experience.
A translucent engine component is displayed, highlighting intricate details and design.
Previous Page
1
…
9
10
11
12
13
…
15
Next Page
We use cookies to ensure that we give you the best experience on our website. If you continue to use this site we will assume that you are happy with it.
Ok