AIHRG Design
About Us
Privacy Policy
Tag Cloud
Terms of Use
Tag:
visualisation
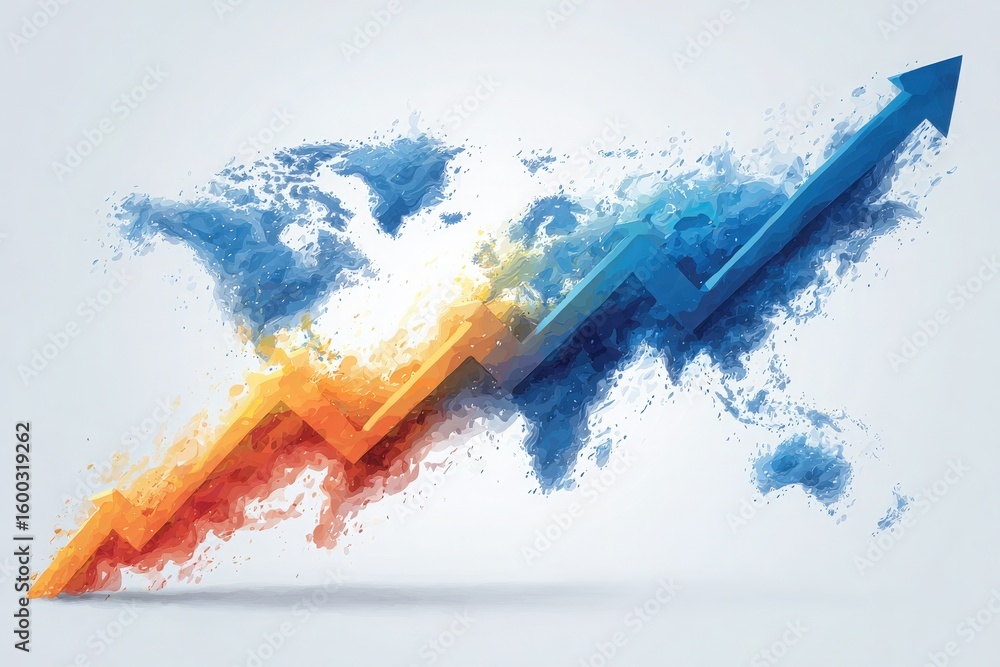
Vivid colors illustrate a rising trend over an artistic world map, highlighting global economic growth. The design features orange and blue arrows symbolizing progress and increase in data.
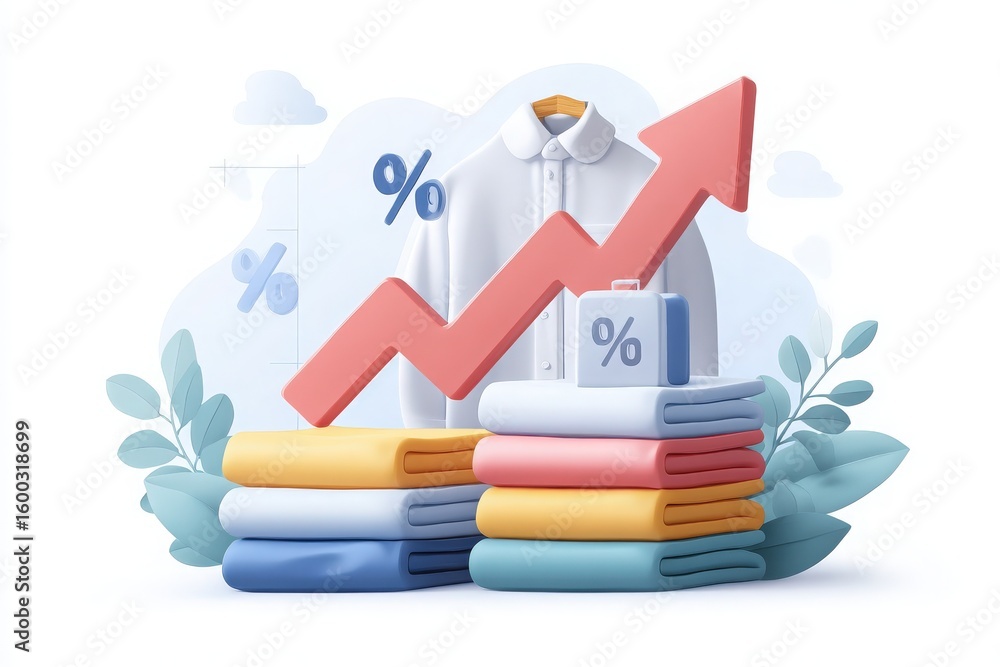
A vibrant display of a shirt hanging on a hanger alongside a rising graph, illustrating growth. Bright greenery and flowers enhance the appealing visual, symbolizing success in the fashion market.
A visual representation of clothing sales growth featuring several neatly stacked garments in various colors, a bold upward trend line with percentages, and a briefcase for business context.
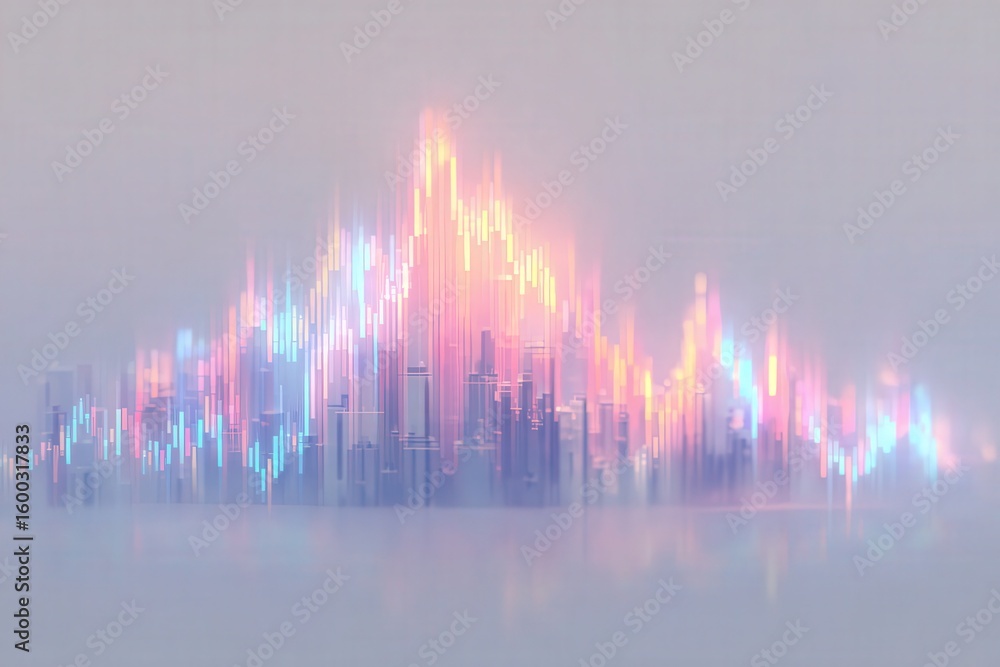
Bright waves of color rise and fall, resembling a city skyline shrouded in mist. The vibrant hues blend together, creating a dynamic visualization of urban life and activity.
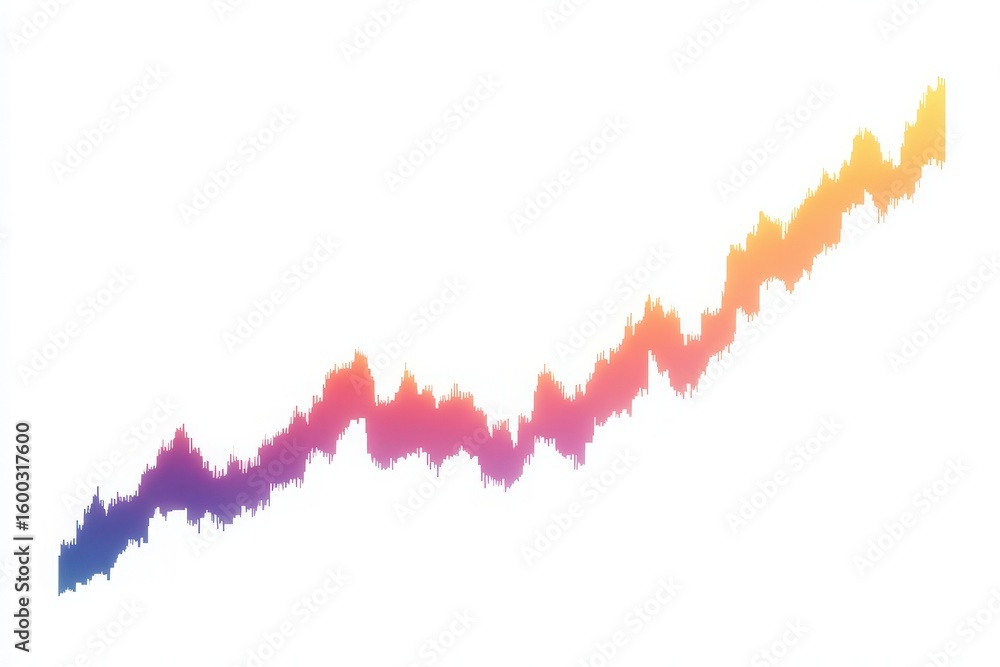
An abstract graph displays a vibrant upward trend marked by hues of purple, pink, and orange. The fluctuating peaks and valleys represent dynamic data patterns and analysis.
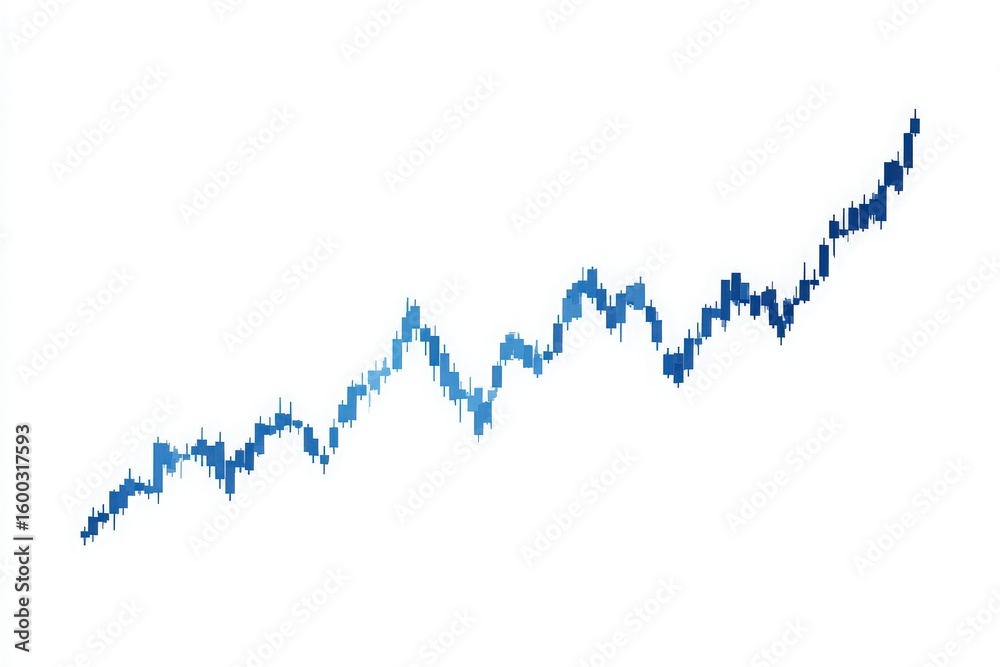
The diagram illustrates a strong upward trend in stock prices with varying shades of blue. The chart highlights significant increases over a period, representing market growth and investor confidence.
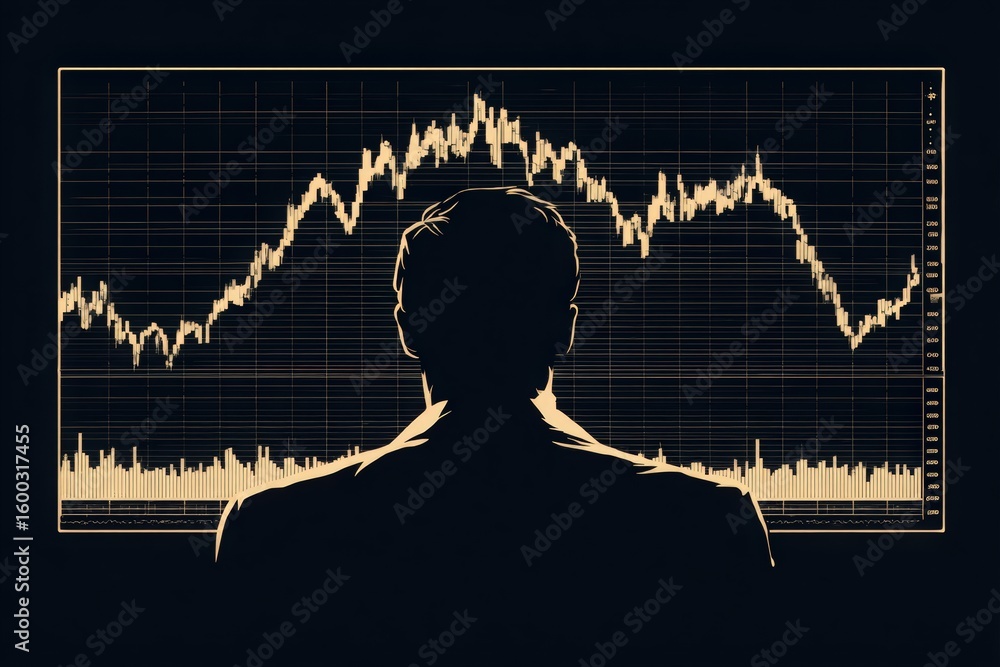
A person stands in front of a digital stock market chart, observing the rising and falling values of investments. The focus is on market analysis and data interpretation.
This visual depicts a three-dimensional data analytics concept featuring various blue charts and colorful location pins. The design highlights the importance of location in data presentation.
Previous Page
1
…
12
13
14
We use cookies to ensure that we give you the best experience on our website. If you continue to use this site we will assume that you are happy with it.
Ok