AIHRG Design
About Us
Privacy Policy
Tag Cloud
Terms of Use
Tag:
analysis
A person in a suit interacts with a holographic figure displaying digital data. The scene conveys advanced technology in a professional setting, emphasizing innovation and future concepts.
This scene presents a close-up of bacteria, highlighting their unique shapes and cellular structures.
This scene showcases interconnected DNA strands glowing in bright pink hues. The intricate structures have a sparkling appearance, highlighting the complexity of genetic information.
A vibrant DNA double helix glimmers with colorful lights on a dark background. This striking visualization highlights the beauty and complexity of genetic structures in a captivating manner.
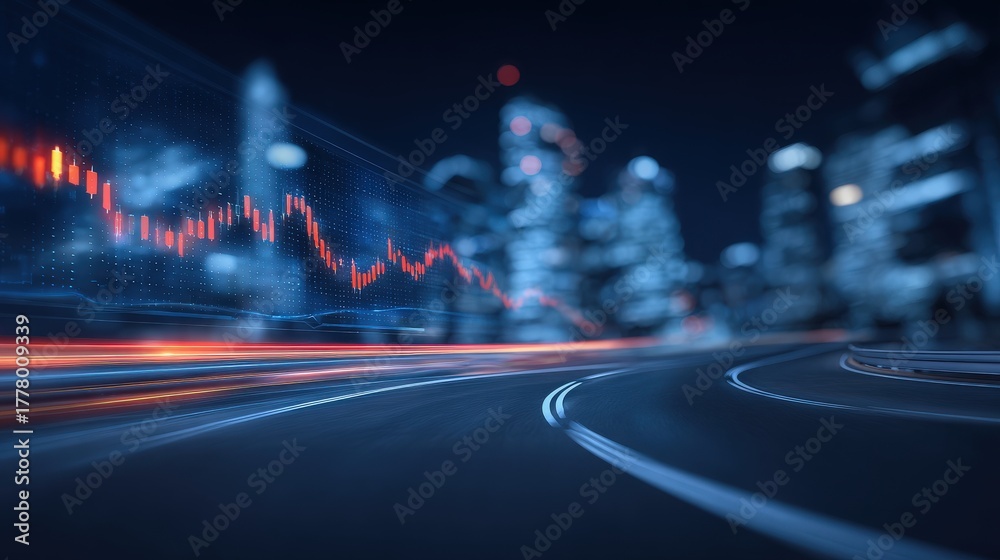
Nighttime city scene features a blurred skyline with illuminated buildings. A digital stock market graph overlays the view, showing fluctuating lines. Light trails from moving vehicles add dynamism.
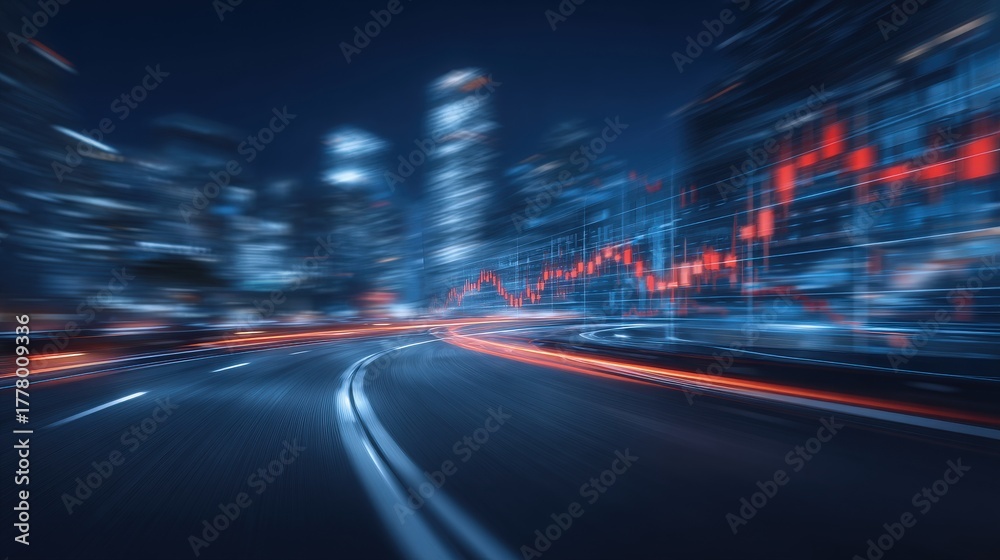
A vibrant city skyline is illuminated against the night sky, featuring blurred lights from vehicles. Superimposed are red stock market graphs, showcasing economic activity and trends.
A man with artistic body paint displays various stock market trends in vibrant colors. The detailed patterns illustrate market fluctuations, creating a striking visual impact.
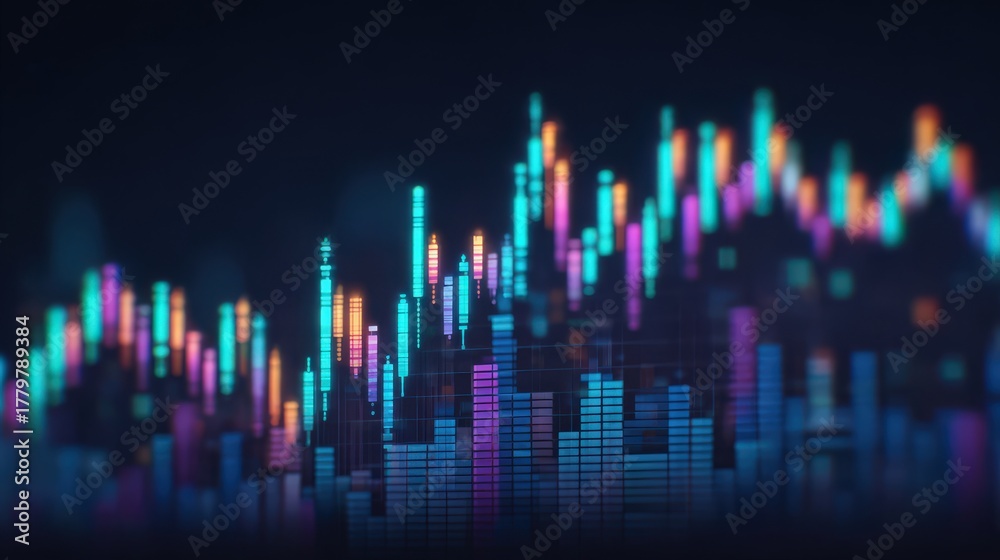
Vibrant graph shows stock market trends with rising bars in blue, purple, orange, and green. The dark background enhances the colorful display, indicating market activity and fluctuations.
In a modern setting, a businessman points at a transparent globe showing a world map, highlighting connectivity and global strategy. This visual emphasizes international business focus.
A businessman sits at a table, focused on reading a document. A light bulb symbol above his head suggests he is having new ideas for projects. The setting conveys creativity and inspiration.
1
2
3
…
7
Next Page
We use cookies to ensure that we give you the best experience on our website. If you continue to use this site we will assume that you are happy with it.
Ok