AIHRG Design
About Us
Privacy Policy
Tag Cloud
Terms of Use
Tag:
analysis
A joyful scientist in a lab coat smiles widely while holding a test tube. The background features celebratory elements, suggesting a successful experiment or discovery.
A joyful scientist in a lab coat holds up a test tube, showcasing excitement about an experiments outcome. The background features laboratory elements like beakers and equipment.
This illustration features a microscope with clear lines and simple shapes. The microscope is positioned upright, showcasing its base, stage, and eyepiece, ideal for laboratory settings and learning.
A detailed representation of a molecular structure showcases black and transparent spheres connected by thin lines in a three-dimensional format.
This is a detailed representation of a complex organic compounds structure, showcasing various functional groups. The intricate lines depict atoms and bonds, highlighting its chemical makeup.
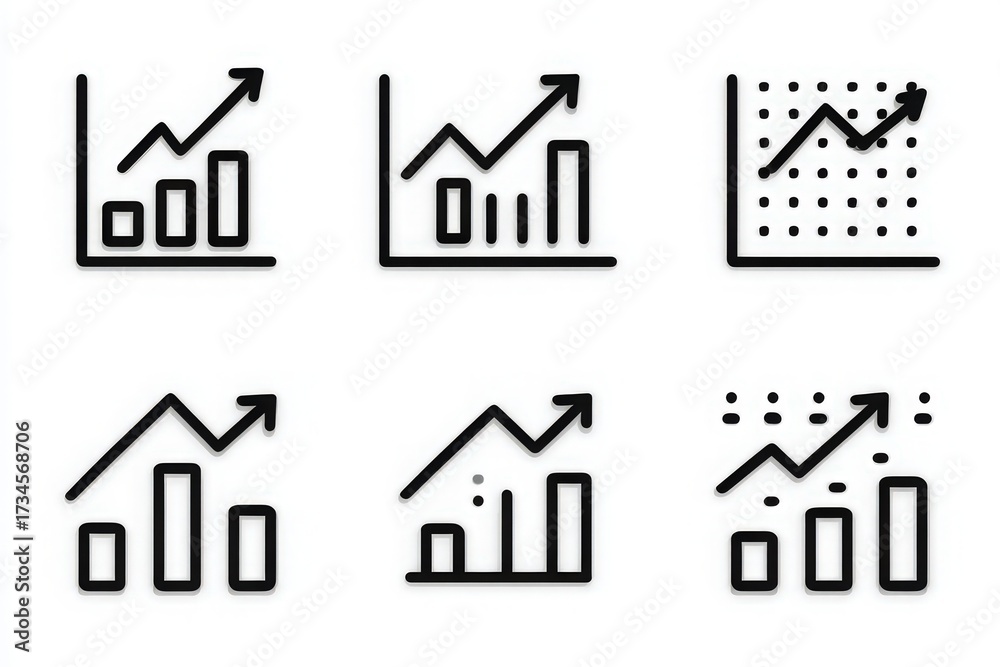
This visual showcases six different styles of graphs, all depicting an upward trend. These representations are commonly used for data analysis, illustrating growth and progress in various fields.
A simple growth chart illustrates an upward trend in data. The bars represent different values, and an arrow indicates positive movement, highlighting progress over a period.
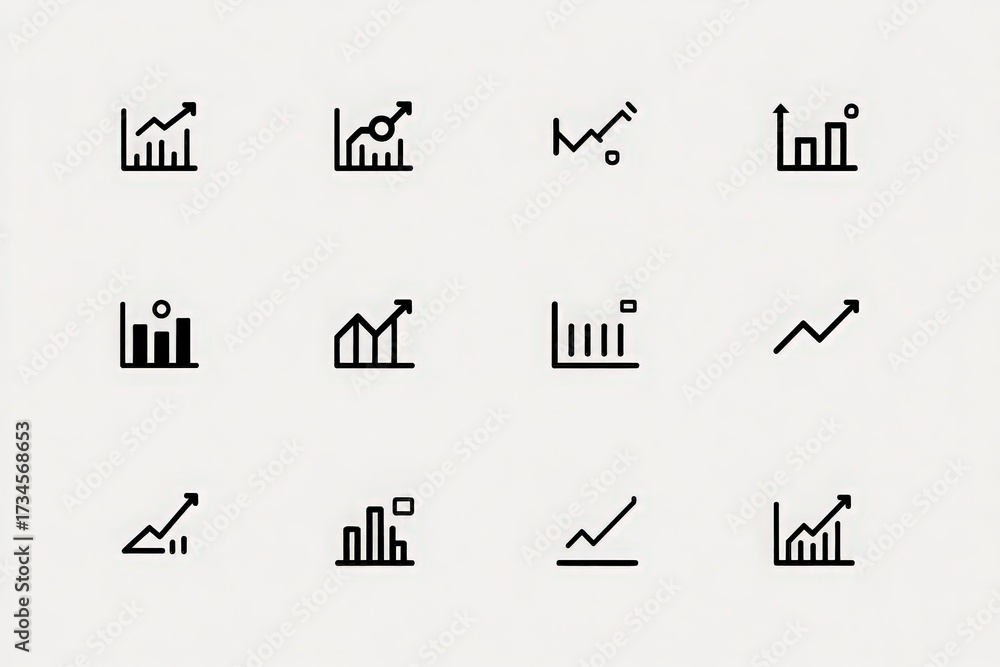
Simple black line graphs on a light background depict various upward trends with different styles. Each graph has different data points and presentation formats highlighting growth or increase.
A simple yet effective design illustrates a growth chart with a line and bar graph. The upward trend emphasizes positive growth, ideal for presentations and reports.
This visual represents a growth chart with upward trends, indicating progress in data or performance metrics. The lines and bars illustrate rising values, symbolizing improvement.
Previous Page
1
2
3
4
…
7
Next Page
We use cookies to ensure that we give you the best experience on our website. If you continue to use this site we will assume that you are happy with it.
Ok